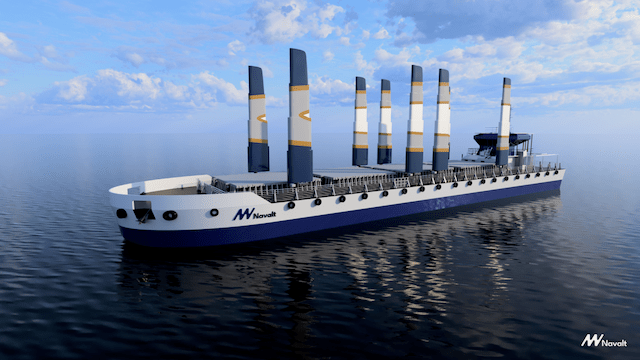

Here are the numbers that show why — for NW-5 specifically
India’s inland waterways are moving freight. NW-5 is being developed with real cargo, real contracts, and real vessels in the plan. The question is not whether to move cargo by water. That decision is already being made. The question is what kind of vessel should be doing it.
Navalt‘s’s position is straightforward: where the cargo exists and the route is defined, the economics of battery-swap electric propulsion are decisively better than diesel. We built a calculator to show exactly that — with full transparency on every number, for the specific conditions of NW-5.
The model covers a 2000-tonne inland cargo barge on National Waterway 5 — the 320 km operational route connecting Talcher’s coalfields to the ports of Paradip and Dhamra in Odisha. It runs a full 28-year Total Cost of Ownership and NPV comparison between a conventional diesel vessel and a battery-swap electric vessel with LFP chemistry and a 20 kW solar plant.
The headline number: Battery swap costs ₹100 Cr in present value over 28 years. Diesel costs ₹258 Cr. The difference is ₹158 Cr — per vessel.
Why NW-5?
NW-5 isn’t a hypothetical. It is an inland waterway in eastern India connecting coal-rich inland regions to major ports along the Bay of Bengal, traversing Odisha and West Bengal. The calculator is built on the 320 km operational route between Paradip/Dhamra and Talcher, and IWAI has been actively moving toward operationalisation — IIT Madras was awarded the TEFR/DPR for Phase II in August 2024, and the formation of the SPV is in its final phase.
Coal, fertiliser, cement, iron ore — the cargo base is real and contracted. The question has never been whether NW-5 can carry freight. It has been whether the economics work.
We built this calculator to answer that question, once and for all.
What the model shows
A 2000-tonne barge at 100% utilisation on a 320-km route completes 175 round-trip voyages a year, carrying 3.5 lakh tonnes of cargo. The battery-swap design uses 9 LFP packs shared across a 6-barge fleet, swapping at three intermediate stations in 30 minutes each, with the 21.7-hour cargo loading/discharge window used for shore charging.
The economics over 28 years:
| Diesel | Battery Swap | |
|---|---|---|
| CAPEX | ₹18 Cr | ₹29.3 Cr |
| TCO (present value) | ₹258 Cr | ₹100 Cr |
| NPV | ₹190 Cr | ₹348 Cr |
| IRR | 47.6% | 52.7% |
| Payback | 3 years | 3 years |
The ₹11.3 Cr CAPEX premium for battery swap is recovered within three years. After that, every year of operation widens the gap. By Year 28, the undiscounted cumulative cost of diesel reaches ₹551 Cr against ₹180 Cr for battery swap — the two lines diverge so sharply they barely belong on the same chart.
The reason is energy. Grid electricity at ₹7/kWh delivers propulsion energy at roughly one-quarter the per-unit cost of diesel at ₹100/litre, and electric drivetrains convert that energy at 90% efficiency versus 35–40% for diesel. Present-value energy cost: ₹204 Cr for diesel, ₹34 Cr for battery swap. That ₹170 Cr swing is the entire story.
The battery swap design is tighter than it looks
One of the more surprising findings from modelling the pack rotation schedule: the system requires exactly one ~500 kW charger per swap station — not a multi-charger array, not a substation-scale installation. The 9 packs charge strictly sequentially across the fleet. At intermediate stops, one pack completes its 4-hour charge cycle precisely 30 minutes before the next barge arrives — and that 30 minutes is the swap operation itself. The swap time is the scheduling buffer.
This matters for infrastructure cost. A single ~500 kW shore charger installed at each of the four stations on the route costs approximately ₹1.5–2.5 Cr per station, or ₹6–10 Cr for the full route. That is a tractable public investment — the kind that unlocks a commercially self-sustaining fleet, not the kind that requires perpetual subsidy.
This is also a national policy question
Beyond the operator’s P&L, the battery-swap barge makes a case that reaches further than project finance.
Diesel import substitution. Each vessel displaces approximately 21.5 million litres of diesel over its lifetime — roughly ₹215 Cr at today’s price. That is foreign exchange that stays in India, redirected toward domestic battery, motor, and solar manufacturing instead of crude oil imports.
Decarbonisation. The diesel baseline is 2,025 tonnes of CO₂ per year per vessel. At India’s current grid emission factor of 0.71 kg CO₂/kWh, the battery-swap vessel emits approximately 1,639 tonnes — a 19% reduction today. As India’s grid decarbonises toward its 2030 renewable targets, that advantage compounds. At a 0.35 kg/kWh grid factor — a plausible 2035 benchmark — lifetime emissions fall by 60%.
Modal shift. India’s inland waterways carry less than 1% of national freight in tonne-kilometres. The government’s Maritime India Vision 2030 targets 5%. A barge that costs ₹158 Cr less to operate than its diesel counterpart — while carrying the same cargo on the same route — is the kind of economic proof that closes that gap.
What we are asking policymakers and investors to see
The barrier to deployment is not technology. LFP batteries are proven. Electric drivetrains are proven. Solar-augmented shore charging is proven. The barrier is coordination: swap infrastructure does not exist at NW-5 terminals, the CAPEX premium is real for smaller operators, and battery pack form factors are not yet standardised for inter-operator interoperability.
Each of these is solvable with targeted, well-defined interventions:
- Fund swap-and-charge infrastructure at Paradip, Dhamra, and intermediate terminals on NW-5. One ~500 kW charger per station. ₹6–10 Cr for the full route.
- Viability-gap funding covering 30–40% of the ₹11.3 Cr CAPEX premium for the first 20–50 deployments.
- A BIS/IWAI standard for LFP pack form factors — voltage, communications, mechanical interface — to enable inter-operator swap interoperability.
- PLI designation for inland battery-electric shipping under the Advanced Chemistry Cell scheme.
None of these is large relative to the value they unlock. The ₹158 Cr NPV advantage per vessel, multiplied across even a modest initial fleet, dwarfs the enabling-condition investment many times over.
IWAI plans 65 barges on NW-5. They should be electric.
IWAI has set a target of 65 barges on NW-5 within five years. That is the right ambition. But the plan as it stands is for conventional diesel vessels — and that is a decision worth reconsidering before the first keel is laid.
The numbers make the case directly. A diesel barge costs ₹18 Cr to build and ₹258 Cr to operate over 28 years. An equivalent battery-swap electric barge costs ₹29 Cr to build and ₹100 Cr to operate. The electric vessel costs ₹11 Cr more upfront and ₹158 Cr less over its lifetime. Every vessel that goes into the water as diesel locks in that ₹158 Cr disadvantage for the next 28 years.
The 6-barge fleet is the natural unit of deployment — six barges share one set of swap-and-charge infrastructure across a single route, with 9 LFP packs cycling on a 1.5:1 ratio. At 6 per deployment, 60 barges is 10 routes and 66 is 11. The calculator models both ends of that journey — a single pilot deployment and a full programme.
| 6 Barges | 60 Barges | |
|---|---|---|
| Routes served | 1 | 10 |
| Total vessel CAPEX | ₹176 Cr | ₹1,758 Cr |
| CAPEX premium over diesel | ₹68 Cr | ₹678 Cr |
| Shore infrastructure | ₹10 Cr | ₹100 Cr |
| Total deployment cost | ₹186 Cr | ₹1,858 Cr |
| Annual cargo throughput | 2.1 million tonnes | 21.0 million tonnes |
| NPV over 28 years | ₹2,088 Cr | ₹20,880 Cr |
| TCO saving vs diesel (PV) | ₹948 Cr | ₹9,480 Cr |
| Annual CO₂ reduction | 2,316 tonnes | 23,160 tonnes |
| Diesel displaced per year | 4.6 million litres | 46 million litres |
| Lifetime import substitution | ₹1,290 Cr | ₹12,900 Cr |
The return on the CAPEX premium is 14:1 — every additional rupee invested over diesel returns ₹14 in present-value operating savings. That ratio holds whether you deploy 6 barges or 60.
We are not asking IWAI to scrap its plan. We are asking a simpler question: given that the electric option costs less to operate, produces more NPV, and reduces diesel imports — what would it take to make the first deployment of 6 electric?
Start there. One route. One set of shore infrastructure. Six barges. The data from that deployment will be the most persuasive document for the next ten.
The calculator is open
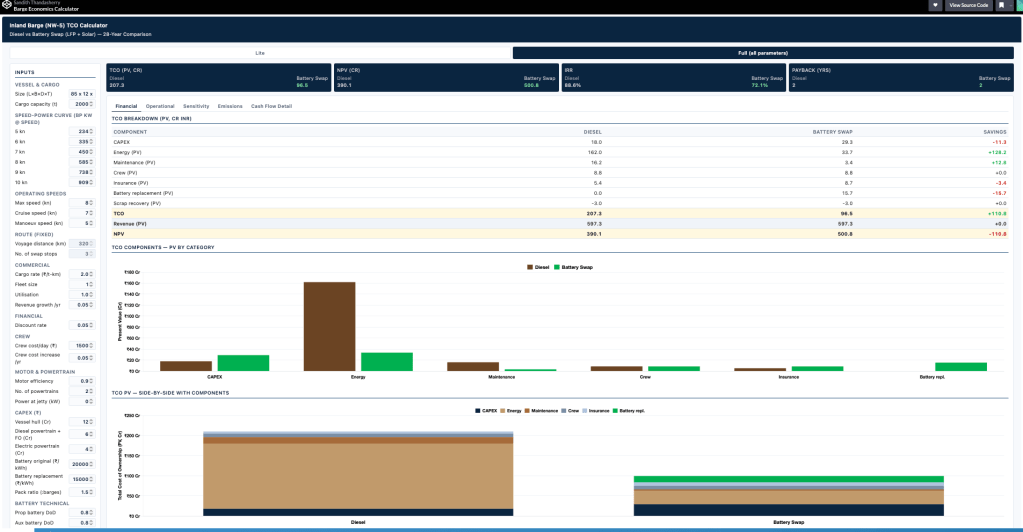
The NW-5 Inland Barge Economic Calculator covers vessel sizing, voyage analysis, battery pack rotation scheduling, 28-year TCO and NPV, sensitivity analysis across diesel price, discount rate, and cargo rate, and full decarbonisation and externality accounting.
The model is built specifically for the NW-5 route — the 320 km distance and three intermediate swap stations are fixed parameters calibrated to the waterway’s geography. What is editable is the commercial and financial layer: cargo rate, diesel price, grid tariff, discount rate, fleet size, battery replacement cost, and utilisation. The model recalculates across all of these, and the sensitivity tables show exactly how robust the case is at each setting.
While you use the calculator it would be of great help to share some numbers you are confident to use – barge cost (diesel), speed-power data (especially 5, 6, and 7 knots, cargo freight rate (per ton-km). You can drop in the comment section under this blog.
Navalt built this because we believe the electrification of India’s inland waterways is not a distant aspiration. It is an investment decision waiting for the right numbers to be visible.
Now they are.
Navalt is an Indian marine technology company building battery-electric propulsion systems for inland and coastal marine applications. The NW-5 Inland Barge Economic Calculator is available online. For the full technical and economic analysis, contact us at navalt.in.
— Sandith Thandasherry, Navalt
 Sandith Thandasherry